


- In the first 10 months of the year, 4,336,957 TEUs (standard container of 6.1 metres in length) have passed through Valenciaport’s terminals, representing a 7.7% drop
- The biggest fall is in full transit containers, 292,434 fewer than the previous year, which represents a -14% drop. Import TEUs continue to show positive figures with an increase of 6.2% while export TEUs fall by 7.1%
- Between January and October 2022, total traffic amounted to 67.72 million tonnes, 4.5% less than in the same period of the previous year
Source: Valenciaport
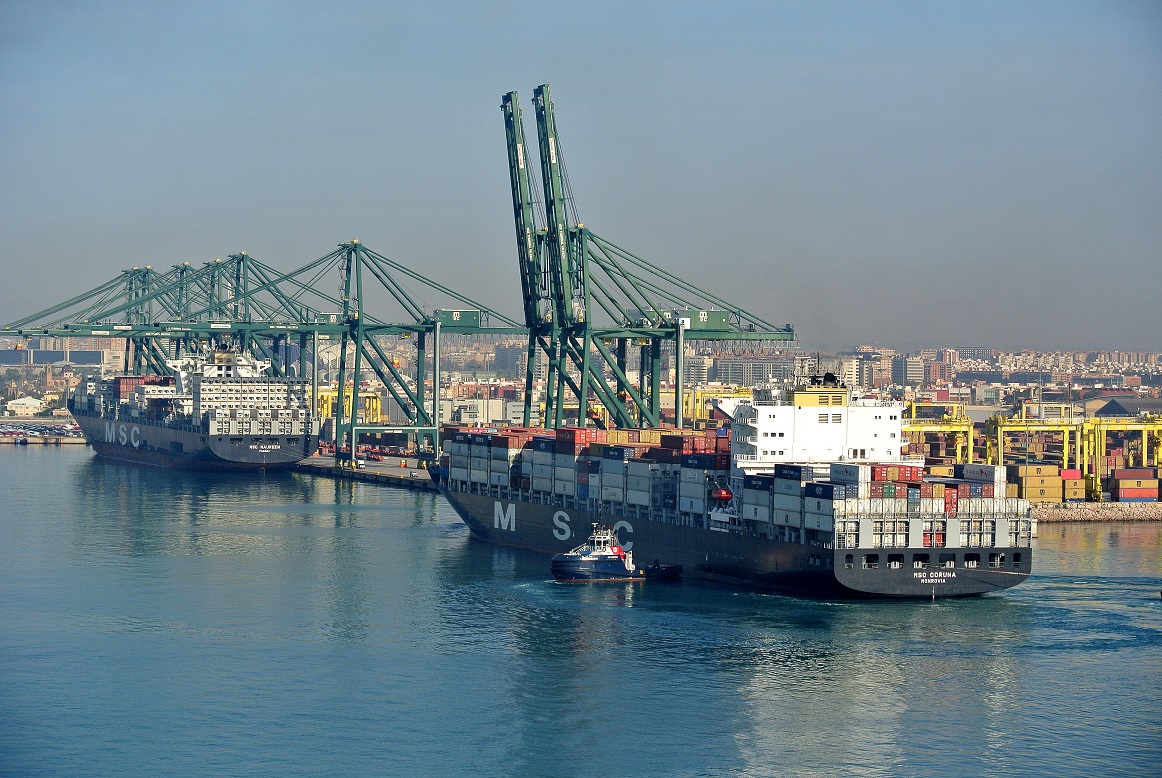
The crisis in the world’s main economies and the geopolitical situation are leaving their mark on traffic at Valenciaport, Spain’s leading logistics infrastructure at the service of import and export companies. Specifically, in the first ten months of the year, this situation is reflected in a fall in the number of containers entering and leaving Valencia, especially those dedicated to transhipment. On the other hand, there have been notable increases in liquid bulk, especially for natural gas, and solid bulk.
Similar circumstances are being observed in the first three European ports. Up to September, container traffic in the port of Antwerp fell by -5%, in Rotterdam by -4.4% and in Hamburg by -2.4%.
Thus, according to data from the Statistical Bulletin of the Port Authority of Valencia (PAV), the total traffic of goods up to the month of October was over 67.72 million tonnes, which represents a decrease of 4.5% compared with the same period the previous year. Of these, 48.4 million correspond to containerised goods which marks a fall of 9.9%, another 12.5 million correspond to non-containerised goods, a similar figure to the 2021 financial year. Liquid bulks reached 4.86 million tonnes with a growth of 61.3%, while solid bulks reached 1.96 million and an increase of 14.5%.
About containers, between January and October, a total of 4,336,957 TEUs have been mobilised, 7.7% less than the previous year. As has been the trend during these months, the biggest drop occurred in transit containers (those which, for strategic reasons, are transported between main ports that act as a base, and which are subsequently transferred to the ports of final destination). In the case of full transhipment containers, during this period they have fallen by 14%, 292,434 fewer in absolute terms that have been moved to other Mediterranean ports. Full containers for loading (export) are also suffering, falling by 7.1%. Unloaded containers (import) continue to record positive figures with a 6.2% growth. Empty containers are down by 4.7% and transit containers by 20.80% (71,943 units less).
In addition to the pull in liquid and solid bulks, in these first ten months of the year it is worth highlighting the dynamism of automobiles in the goods regime. Thus, 491,090 units have been handled through the docks of Valencia and Sagunto, an 18.32% increase. As for ro-ro traffic (system by which a vessel transports cargo on wheels), total traffic was 10,889,947 tonnes, 0.77% more than the same period in 2021.
Among goods, it is worth noting the generalised decrease in traffic in all sectors except energy (+81.7%), other goods (+4.43%), vehicles and transport elements (+2.45%) and agricultural, livestock and foodstuffs (+2.35%). By products, it is worth highlighting the 5.64% increase in exports of automobiles and their parts, imports of cereals and their flours (+45.7%). Regarding natural gas, 3,415,672 tonnes have been mobilised in these months of 2022 compared to 1,539,379 tonnes in 2021.
In terms of total traffic by country, the United States has generated the most movement with a total of 7,332,167 tonnes and a growth of 14.5%. This is followed by Italy with 6,392,110 tonnes – a similar figure to 2021 – while China is in third place with a decrease of 7.6% and a total of 5,261,717. The Asian giant occupies the first position in container traffic with 460,409 (-8.6%), followed by the United States with 426,083 (-4.37%) and Turkey with 215,902 (-19.2%). By geographical areas, the main container market is the Mediterranean-Black Sea with 705,146 and a drop of 14.5%; followed by the Far East with 629,698 (-5.6%); and West Africa with 252,449 TEUs (-9%). The most dynamic areas between January and October were Atlantic Europe with a growth of 32.5%, Australia (+16.3%) and New Zealand (+19.4%).
![]()