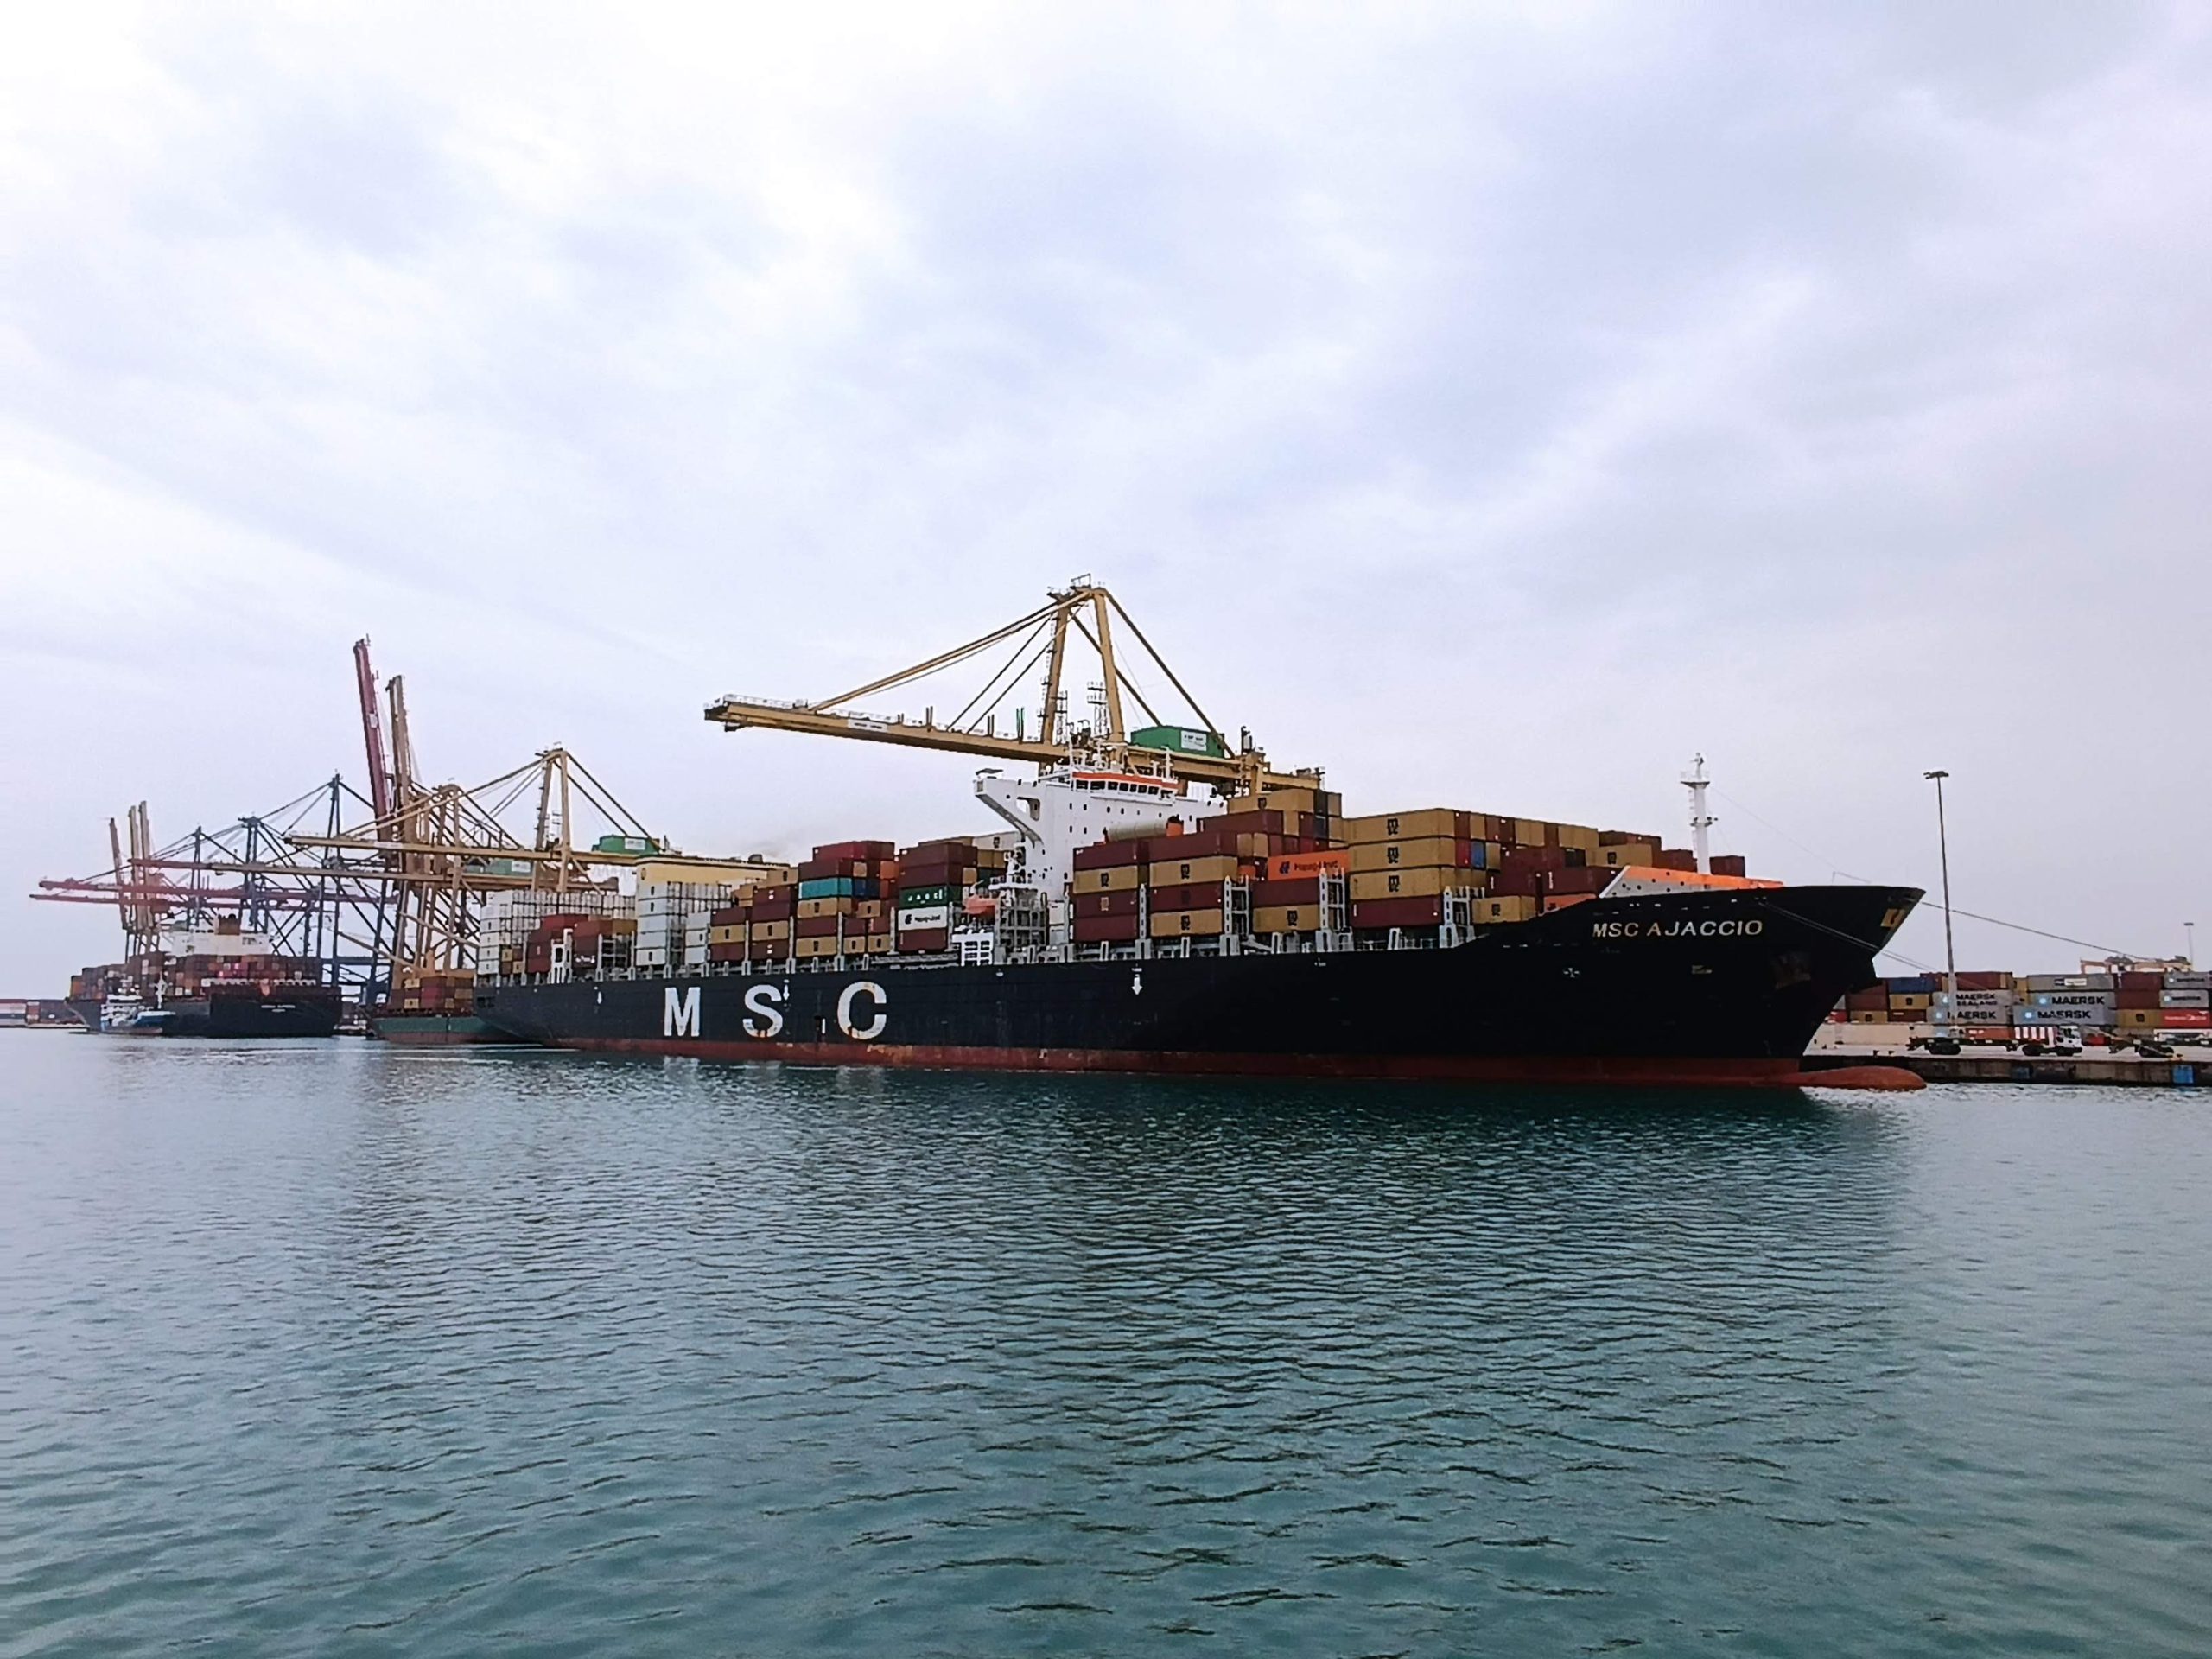
- The Port of Valencia confirms its position as the reference point in Southern Europe for international trade in containerised goods
- Between January and November, total traffic amounted to 73.18 million tonnes, 6.12% less than the same period in 2021, while container traffic fell by 9.55%
- The arrival of natural gas at the Port of Sagunto has doubled during this period compared to 2021, mainly from the United States
- The fall in container traffic is compensated by the increase in liquid bulk (+60.3%) and solid bulk (+9.76) and vehicle traffic, which increased by 18.53%
- The North American country is the main trading partner in terms of total traffic with 7.7 million tonnes (+11.8%). China has handled the most containers with Valenciaport with 494,950 (-11%)
Source: Valenciaport
The economic crisis, especially aggravated in international trade since the beginning of the invasion of Ukraine by the Russian army, is redesigning the composition and structure of traffic at Valenciaport. Between January and November, more than 73 million tonnes of goods passed through the docks of Sagunto, Valencia and Gandia, a figure that is 6.12% less than in the same period of the previous year. And the same is true of container traffic, which in the first 11 months of the year has fallen by 9.55% – especially in transhipment TEUs – a trend that is occurring worldwide. Nevertheless, the Port of Valencia confirms its position as the benchmark in Southern Europe for international trade in containerised goods. And this can be seen in Valenciaport’s market share with respect to the Spanish port system. A share that has remained close to 40% for several years; and also, during the current financial year, as was seen last January with 39.91%, and currently – at the end of November – with 39.58%.
In this conjunctural situation, it should be noted that the natural gas handled through the Port of Sagunto has doubled in the first eleven months of the year compared to the same period last year. So far in 2021, a total of 3,755,983 tonnes have been mobilised, an increase of 115%. In fact, the number of ships dedicated to the transport of products such as energy has been 297 up to November, 13.4% more than the previous year. The United States accounts for 53% of imports, followed by Nigeria, which holds 20%, highlighting the increase in natural gas from this African country in recent months.
Conditioned by the international situation
Thus, total freight traffic up to the month of November exceeds 73.54 million tonnes, which represents a decrease of 6.12% compared to the same period of the previous year. Of these, 51.97 million correspond to containerised goods, which marks a fall of 11.84%, while another 13.7 million correspond to non-containerised goods, a similar figure to the 2021 financial year. Liquid bulk cargo reached 5.37 million tonnes with a growth of 60.33%, while solid bulk cargo reached 2.14 million tonnes and an increase of 9.76%.
The economic crisis is particularly noticeable in the movement of containers, a structural situation for the world port system. Thus, between January and November, a total of 4,670,160 TEUs (standard 20-foot container) have been mobilised in Valenciaport, 9.55% less than the previous year. The fall was mainly in transit containers (those which, for strategic reasons, are transported between main ports that act as a base, and which are subsequently transferred to the ports of destination) with a drop of 16%, containers that have been transferred to other ports in the Mediterranean. This trend has been observed throughout the year, with relative monthly drops in double digits.
About export containers, the data up to November show a drop of 8%, while full TEUs for unloading (import) continue to record positive figures with a growth of 3.39%. Empty TEUs fell by 6.5%. Nevertheless, Valenciaport continues to maintain a share of close to 40% of the export/import traffic of the Spanish port system.
For the month of November alone, the Bulletin data show a 22.3% drop in total traffic and a 28.12% drop in containers, which recorded negative figures for loading, unloading and transit. In year-on-year terms (December 2021-November 2022), 80.07 million tonnes have been mobilised (-6%) and TEUs stand at 5,111,266 (-9.5%).
Sectors and countries
Among goods, it is worth noting the general decline in traffic in the first eleven months of the year in all sectors except energy (+77.81%), other goods (+3%), vehicles and transport elements (+1.5%) and agricultural, livestock and foodstuffs (+0.66%). By products, it is worth highlighting the 6.69% increase in exports of automobiles and their parts, and the 10.34% increase in feed and fodder, and imports of cereals and their flours (+33.8%).
About total traffic by country, the United States is the one that has generated most movement with a total of 7,779,518 tonnes and a growth of 11.8%. This is followed by Italy with 6,954,211 tonnes – a similar figure to 2021 – while China is in third place with a decrease of 9.5% and a total of 5,661,562. The Asian giant ranks first in container traffic with 494,868 (-11%), followed by the United States with 454,950 (-6.7%) and Turkey with 233,940 (-19%).
By geographical areas, the main container market is the Mediterranean-Black Sea with 760,743 and a drop of 15%; followed by the Far East with 678,665 (-7.95%); and West Africa with 270,264 TEUs (-11%). The most dynamic areas between January and October were Atlantic Europe with a growth of 23.4%, New Zealand (+17.4%) and Australia (+7.65%).
![]()


