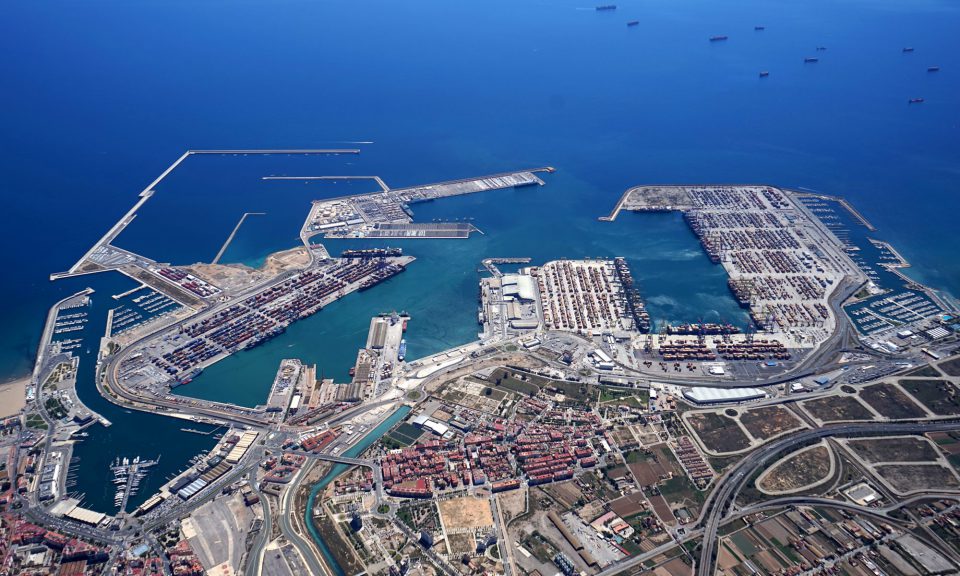
Source: Valenciaport
The current economic and geopolitical situation is reflected in the fluctuations in the data of the Valencia Port Authority’s Statistical Bulletin. Thus, according to the latest report for the month of May, there is a slight recovery in the number of containers full of cargo (export) in this month (+0.55%) compared to May 2021, breaking the negative trend of recent months. On the other hand, full unloading containers (import) continue with the positive evolution by increasing by 14.75%, while full containers dedicated to transhipment fell by 7.4%, and empty containers (highly demanded, especially by Valencian export companies) rose by 6.87%.
In total, the TEUs (standard 20-foot containers, or 6.1 metres) managed by Valenciaport in May stood at 477,229 units, which represents an increase of 0.22% compared to May of the previous year. Total freight traffic in this month was 7,722,130 tonnes, which represents an increase of 7.8%, mainly due to the increase in both solid and liquid bulk.
In the accumulated year-to-date (January-May) the trend shows the consequences of the economic and geopolitical situation, as well as the peaks of congestion that the Port of Valencia has suffered. Thus, in the first five months a total of 34,770,265 tonnes have been handled, 1.34% less than the same period in 2021. In terms of containers, the total figure was 2,179,465, 6.31% less than the previous year. Of these, 1,723,914 were full TEUs, -6.78%, of which 408,356 were export (-9.74%), 360,100 import (+8.53%) and 955,458 transit (-10.29%). The number of empties reached 455,551 with a decrease of 4.5% in the year accumulated.
A trend that is also reflected in year-on-year terms (Jun21-May22 compared to the same data for the previous year), where a 0.31% increase in total goods is seen, reaching 84.41 million tonnes. With regard to containers, the total figure mobilised in these 12 months was 5,457,635, which represents a decrease of 2.81% compared to the same period. Full containers fell by 3.46%, of which 1,037,058 were mobilised for export (-0.53%) while import containers amounted to 865,876 (+15%). On the other hand, those for transit fell by 9.91%, 260,000 containers less than in the previous twelve months. This decrease in transhipment due to peaks of congestion in the Port of Valencia for reasons such as the transport stoppage or storms, has meant that traffic has been diverted to other destinations.
Data by goods and countries
Data from the PAV Statistical Bulletin indicates that ro-ro traffic (system by which a vessel transports cargo on wheels) in the first five months of the year amounted to 5,363,737 tonnes, 2.96% more than in the same period of 2021. During this time, 246,362 units of cars were mobilised as freight, up 6.2%. In terms of passenger traffic, a total of 325,403 people have moved (including regular lines and cruises), 170% more.
If we analyse the total traffic by form of presentation, liquid bulk increased by 93.45%, solid bulk by 14.58%, non-containerised goods increased by 5.29%, while containerised goods fell by 7.48%.
The economic activity of the sectors operating in Valenciaport continues to be marked by the world crisis in the energy sector, the war in Ukraine, the price of fuel, the increase in the cost of energy and the scarcity of raw materials. This is reflected in the foreign sales of all the industries that use the docks of the València, Sagunto and Gandia enclosures, with generalised decreases, although more moderate than in previous months, in all of them such as vehicles and transport elements (-2.94%), agri-foodstuffs (-10.95%), construction materials (-7.44%), chemical products (-13.22%) and other goods (-17%). On the other hand, imports grew, especially natural gas arriving at the Port of Sagunto, which between January and May amounted to 1,548,375 tonnes, an increase of 190%.
About total traffic by country, the United States is the one that has generated most movement with a total of 3,897,785 tonnes and a growth of 22.36%. This was followed by Italy with 3,289,971 tonnes and an increase of 4.22%, while China, with a decrease of 5%, generated a total of 2,676,069 tonnes. The number of containers handled with China was 235,689 (-7.43%), followed by the United States with 216,683 (-2.2%) and Turkey with 113,697 (-18.21%). The most dynamic countries between January and May were the United Kingdom (+87%), Vietnam (+43.94%) and Greece (+23.11%).
By geographical areas, the main container market is the Mediterranean-Black Sea with 381,179 and a decrease of 9.48%; followed by the Far East with 324,686 (-3.24%); and West Africa with 140,114 TEUs (-4.34%). The areas that have grown the most in the first five months have been Atlantic Europe with a growth of 61%, Australia (+21.6%) and South and East Africa (+15.3%).
![]()


